
Diagnosis · Updated 22 August 2026
Why did this go viral? Compare it with what stayed ordinary
Why did this go viral? See how an 86.7× TikTok breakout lost six plausible explanations when compared with ordinary posts.
One TikTok reached 50,065 views—86.7× the creator's recent median. We watched it beside three ordinary posts expecting the winner to reveal a repeatable hook.
It did not. Six of seven plausible explanations were contradicted by the controls. The seventh stayed uncertain. The most useful result was learning what not to copy.
To answer “why did this go viral?”, compare the breakout with what stayed ordinary before turning a visible difference into a theory.
This method is useful when you have a public breakout and enough nearby posts to form controls. It cannot identify paid distribution, private retention, conversions or why an unpublished draft failed. Those questions need account analytics or a controlled test.
This is an independent case study of public third-party content, not a reels.chat campaign or customer result. reels.chat did not create or publish the content and has no private campaign analytics for it.
Start with a relative outlier
“Viral” is a poor comparison group. A post with 80,000 views may be ordinary for one account and a breakout for another.
Start with the creator's recent baseline. Use a median rather than an average so one old hit does not pull the baseline upwards. Compare posts at a similar age where possible, because a three-day-old post has had less time to accumulate views than one published months ago.
Record the post's views and age, the median across a reasonable sample of the creator's recent posts, its multiple over that median, and visible context such as a collaboration, sponsorship or current event. This does not prove that the creative caused the extra distribution. It establishes that there is something worth diagnosing.
Choose controls before choosing a theory
The creator's ordinary posts are the fastest way to disprove an attractive explanation. Choose controls that hold one feature steady while another changes.
| Control | What stays similar | What it tests |
|---|---|---|
| Same creator, similar topic, different opening | Account and subject | Whether the opening is the stronger candidate |
| Same creator, similar opening, different topic | Account and opening pattern | Whether topic or proof carried the result |
| Same creator, similar format, ordinary result | Account and container | Whether the format alone explains the breakout |
| Different creator, similar structure | Format or loop | Whether the pattern transfers beyond one account |
Two or three well-matched controls are more useful than twenty vaguely related viral videos. Keep the selection rule visible so you do not quietly replace a control after it weakens your preferred theory.
A real five-video test
We ran this method on the public TikTok account @val32003. When captured on 22 August 2026, the profile had 1,476 followers and a stored recent-post median of 577.5 views across 30 posts.
Five videos, one creator, the same production language
Play each archived watch. The first-frame cover gives way to the durable video without a flash.
Creator-relative breakouts
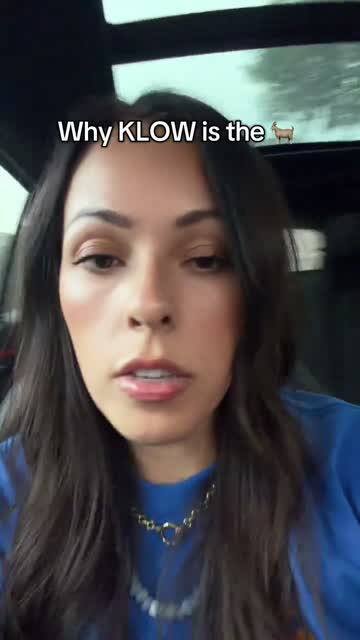
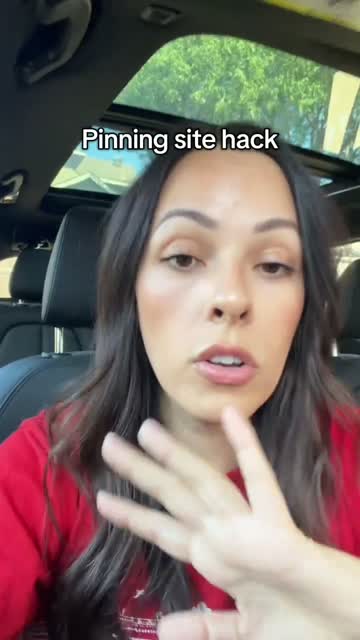
Matched ordinary controls
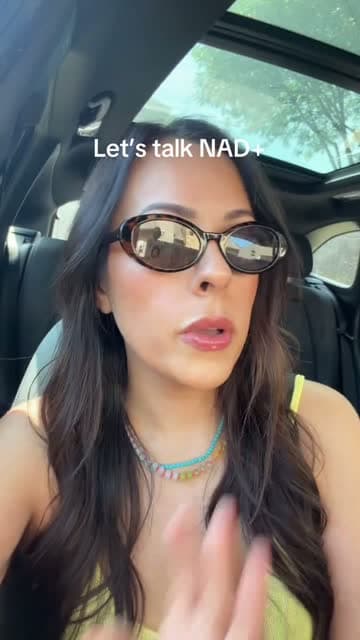
A NAD+ explainer with the same car setup, personal result, product mention and withheld-discovery framing.
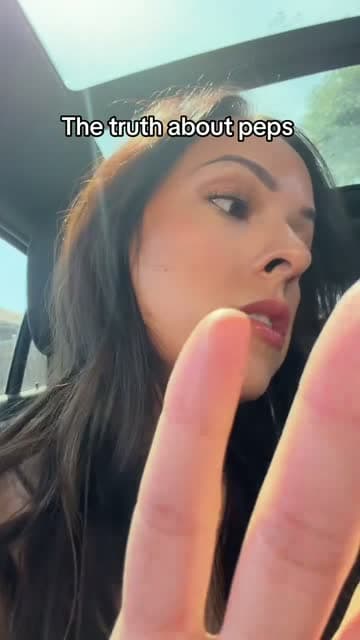
The truth about peptides, told with the same creator-native production, testimonial and app CTA.
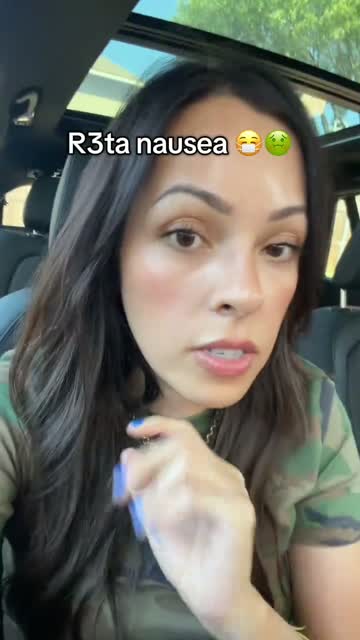
The two breakouts reached 50,065 and 37,887 views, or 86.69× and 65.61× the creator's median. We matched them against three posts from the same creator and app campaign at 3,323, 2,090 and 1,571 views. The controls kept the car setup, product mention, personal result, practical advice, insider framing or app CTA while changing the topic and opening.
The important result was not a hook formula. With winners alone, all seven hypotheses were uncertain. Once the matched controls were added, six were contradicted and one remained uncertain. None was supported.
The car selfie format, simple overlays, app mention, personal testimonial, specific peptide problem, practical tips and insider framing all appeared in both cohorts.
Even the engagement story weakened when we changed totals into rates. A 22 August refresh for one winner and one control found favorite rates of about 0.79% and 0.81%. Across the five stored records, every control had a higher like rate than both winners; share and comment rates were mixed. The refresh and stored creator baseline came from different dates, so we kept the original outlier ratios rather than combining snapshots.
The public sample confirmed two breakouts but did not isolate a winner-specific creative mechanism.
That is a successful diagnosis. It stopped the analysis from naming the creator's normal house style as the secret sauce.
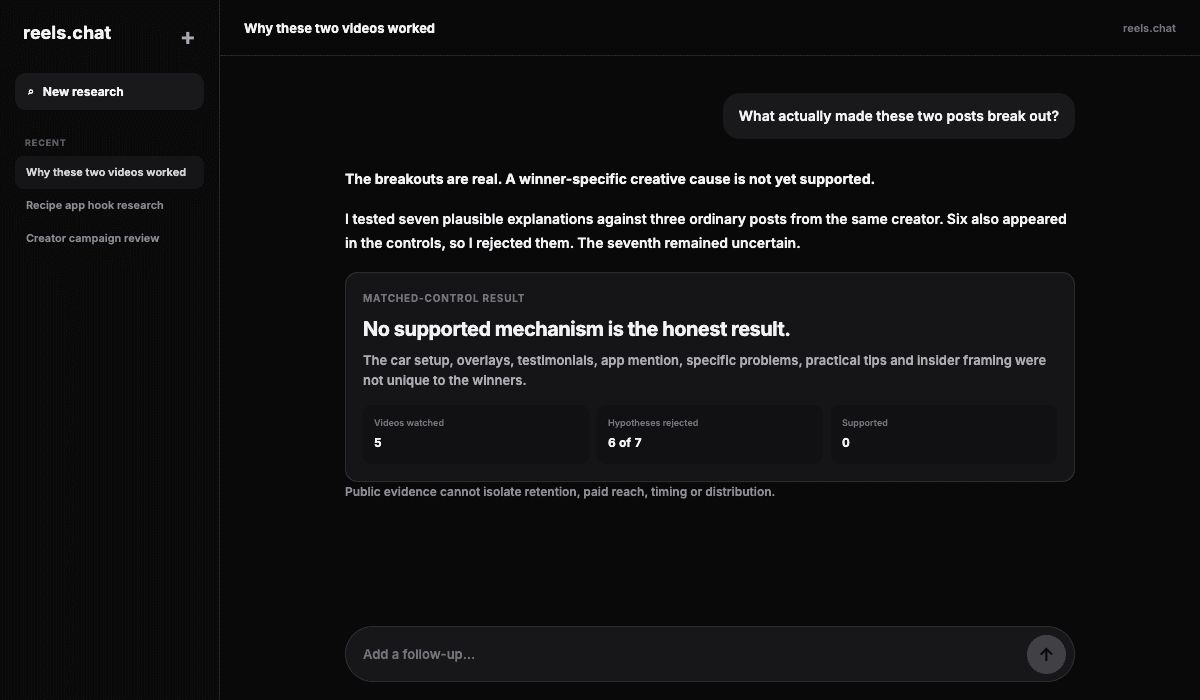
The useful result was a narrower claim, not a made-up formula.
Method note: on 22 August 2026, five fresh video classifications plus the first two reducer arms completed in 55.5 seconds and cost $0.0206 in model spend. A clean reproduction using the archived media, one matched-control reducer and two captured enrichments was estimated at about $0.0279. These are first-party method-development costs, not product pricing.
How to tell whether the hook, format or topic caused the breakout
Calling every visible difference “the hook” makes the explanation impossible to disprove. Split the diagnosis into three causes with different confirmation rules.
| Candidate | How to confirm it | What to do if it survives |
|---|---|---|
| Opening | Hold creator, topic and body as steady as possible; check whether ordinary posts start slower or hide the result | Test a new first visual, overlay or spoken sequence on the same body |
| Format | Find ordinary posts where the creator uses the same container, then check whether the beat order also transfers across creators | Use the beat order only where it fits the idea; test it without copying the creator's styling |
| Topic–proof loop | Compare posts with similar specificity, proof and advice but different subjects; ask whether the winner has evidence the controls lack | Test one relevant problem with proof your product can honestly reproduce, then measure hold and action |
In the five-video test, none survived cleanly:
- Opening: insider framing and early claims also appeared in the controls.
- Format: car selfie production and simple overlays appeared in all five posts. They were house style, not an isolated winner feature.
- Topic–proof loop: the controls also had specific problems, testimonials, practical tips and the app CTA. Topic demand, timing and unavailable retention remained unresolved.
More than one cause can survive. Give each one a separate test instead of blending them into a story that cannot lose. In this case, none of the three categories earned a supported causal claim from public evidence.
Watch the post before interpreting it
Write a factual beat sheet before explaining anything:
- first frame;
- exact on-screen text;
- first spoken phrase;
- first visual change;
- timestamp where the promise becomes clear;
- first proof timestamp;
- major beats and payoff;
- CTA;
- visible context that may affect interpretation.
Separate observation from inference. “The completed result is visible in frame one” is an observation. “People watched because transformations are satisfying” is a theory.
Then watch the controls in the same way. If a supposed secret also appears in ordinary posts, it cannot explain the difference on its own.
What this case study suggests testing
If you want to apply this case study to your own content, treat the opening as load-bearing when it identifies the subject, intended viewer and payoff quickly while the rest of the post mainly fulfils that promise. Test it muted, audio-only and with a counterfactual slower setup.
Format is the repeatable container after the opening: comparison, teardown, screen recording, before-and-after, ranking, demonstration, reaction or step sequence. It becomes a stronger candidate when the same beat order produces outliers across different topics or creators. It becomes weaker when the creator uses it repeatedly and most examples remain ordinary.
The topic–proof loop is the relationship that may only work in this post:
Specific problem → credible proof → escalating detail → payoff that resolves the opening.
Ask whether your product has equivalent proof. If the original depends on a receipt, physical transformation, live result or personal authority that you cannot reproduce honestly, copying the opening or format will create a weaker imitation.
Use comments to choose the follow-up, not explain reach
After the matched controls ruled out six creative explanations, comments answered a different question: what did the post make people talk about?
On 22 August 2026, a bounded pull recovered 18 viewer-authored comments on the winner. One pull for the control returned one comment and another returned six. The winner's sample contained symptom disclosures, troubleshooting questions, additional remedies, corrections, failed fixes and a substantive safety objection. That suggests a richer problem-specific conversation. It does not explain the difference in reach, retention or conversion.
Comments can reveal what viewers asked, resisted, misunderstood or repeated. They cannot explain why silent viewers stayed, why the platform expanded distribution or whether the post converted.
| Comment signal | What it can support | What it cannot prove |
|---|---|---|
| Repeated question | Missing context or a follow-up angle | That most viewers were confused |
| Objection or counterexample | A claim boundary worth addressing | That the original claim is false |
| Personal experience | Audience language and use cases | A representative outcome |
| Creator reply | Clarification and intended meaning | Independent validation |
| Praise, tags or emojis | Salience and share language | Retention, reach or purchase intent |
The first production summary returned zero keyword clusters and exposed zero literal comments for the enriched winner and control. The raw endpoint still held useful comments. The summary layer had discarded anything that did not match app-attribution terms.
That is a useful research-system warning: a blank summary is not proof that the source is empty. Keep a bounded literal sample beside any generated cluster or summary. In this pull, none of the recovered winner comments was creator-authored.
Keep literal comments separate from their summary. Preserve the source post, comment identifier, like count, creator/viewer authorship and retrieval time. State the sample size. Moderation, ranking, provider instability and silent-viewer bias remain.
Write a bounded confidence statement
An honest answer to “why did this go viral?” finishes with the strongest surviving candidate, the comparison supporting it and the important missing data. In this case, the correct statement was:
The public sample confirms two creator-relative breakouts, but does not isolate a winner-specific creative mechanism. Topic demand, timing, distribution, paid activity, unavailable retention or a finer-grained feature may explain the difference.
That is stronger than “the hook was good.” It names what the comparison ruled out and what the evidence cannot establish.
Remix one load-bearing part
Choose one candidate and hold the others steady.
- Opening test: same topic and body; change only the first visual, overlay or spoken sequence.
- Format test: normal topic and claim; use the observed beat structure.
- Loop test: preserve the relationship between problem, proof and payoff with evidence your product can genuinely show.
Pick the success metric before publishing. Repeat the result on another suitable idea before calling it a pattern.
If you own the account, separate three outcomes:
| Stage | Question |
|---|---|
| Opening | Did the intended viewer stay? |
| Hold | Did the body pay off the promise? |
| Action | Did the right person take the next step? |
A reach winner is not automatically a business winner. A quieter proof-led post may bring more qualified profile visits, signups or purchases.
Leave with a falsifiable test
Good analysis can end with no supported cause. It should not end with nothing to test. Write down the next experiment before the attractive explanation hardens into a rule.
| Field | What to write |
|---|---|
| Breakout | Source post, capture date, public result and creator-relative baseline |
| Controls | Two or three nearby posts and the feature each one holds steady |
| Candidate cause | Opening, format or topic–proof loop |
| Evidence for | The winner-only difference you actually observed |
| Evidence against | The control that weakens the explanation |
| Missing data | Retention, traffic source, paid activity, conversions or another unavailable signal |
| Next test | One change, one held-steady body and one success metric |
| Falsifier | The result that would make you drop or narrow the theory |
The diagnosis is useful when it says what appears load-bearing, what comparison supports that choice and what result would prove the interpretation wrong.
Frequently asked questions
Why did this go viral?
Public data rarely supports one certain cause. Compare the opening, format and topic–proof loop against ordinary posts from the same creator, then choose the strongest test candidate and state what the evidence cannot prove.
Are comments a ranking signal?
This method does not assume they are. Public comments are used as qualitative evidence about questions, objections and language, not as proof of distribution or causation.
Is the hook always why a video worked?
No. The opening may stop the swipe while the format, topic, proof, creator history or distribution drives the wider result.
How do I reverse-engineer a viral video without copying it?
Write the beat sheet, compare matched controls, abstract the sequence and viewer promise, then test one load-bearing relationship with your own footage, wording and proof.
If you need the broader pattern first, start with how to extract hook patterns from videos that already performed. If the question is whether one creator repeats an opening successfully, audit their last 10–15 openings before prescribing a new one.
The same comparison works on photo posts. Start with why these slideshow hooks worked, then look at a few applied cases: the Stronger two-slide, a Costco snack list, a CareSkin acne glow-up, a red-flag-to-keeper list, and the datingwithmads 27× median. The rest of the cluster is on the video diagnoses hub.
Keep reading
Diagnosis
TikTok hold rate: when the hook works but viewers leave
Diagnose a weak TikTok hold rate after the hook by checking the promise, pacing, audience fit, and the exact retention metric you are reading.
Diagnosis
Why this CareSkin before-and-after TikTok slideshow worked
A 12.5M CareSkin before-and-after TikTok slideshow mixed an acne glow-up, an app reveal, and product proof. See what the evidence supports.
Diagnosis
Why this Costco snack-list TikTok slideshow worked
A 9.6M Costco snack-list TikTok slideshow put a useful list before the app reveal. See which parts of the app-marketing format are worth testing.