
Diagnosis · Updated 24 August 2026
Why this Costco snack-list TikTok slideshow worked
A 9.6M Costco snack-list TikTok slideshow put a useful list before the app reveal. See which parts of the app-marketing format are worth testing.
The Costco cart earned the first look. It does not explain why an 11-image toddler-snack post reached 9.57 million plays.
The stronger diagnosis is that the post became a shopping reference: one clear cart promise, then five products paired with five screens that judged them. The cart was the hook. The save sheet was the payoff.
On 24 August 2026, TikHub recorded 9,568,045 plays, 131,115 likes, 26,948 shares, and 86,943 saves on the cited photo post. It was a genuine account-relative outlier, reaching 1,143 times the median of the creator’s latest 33 photo posts.
The creator profile and every TikTok discussed in this diagnosis are snapshotted below.
Seven photo posts, one creator, very different outcomes
Ratios use the 8,368-play median from the latest 33 photo posts. Open a card to inspect the full TikTok sequence.
Cited Costco breakout
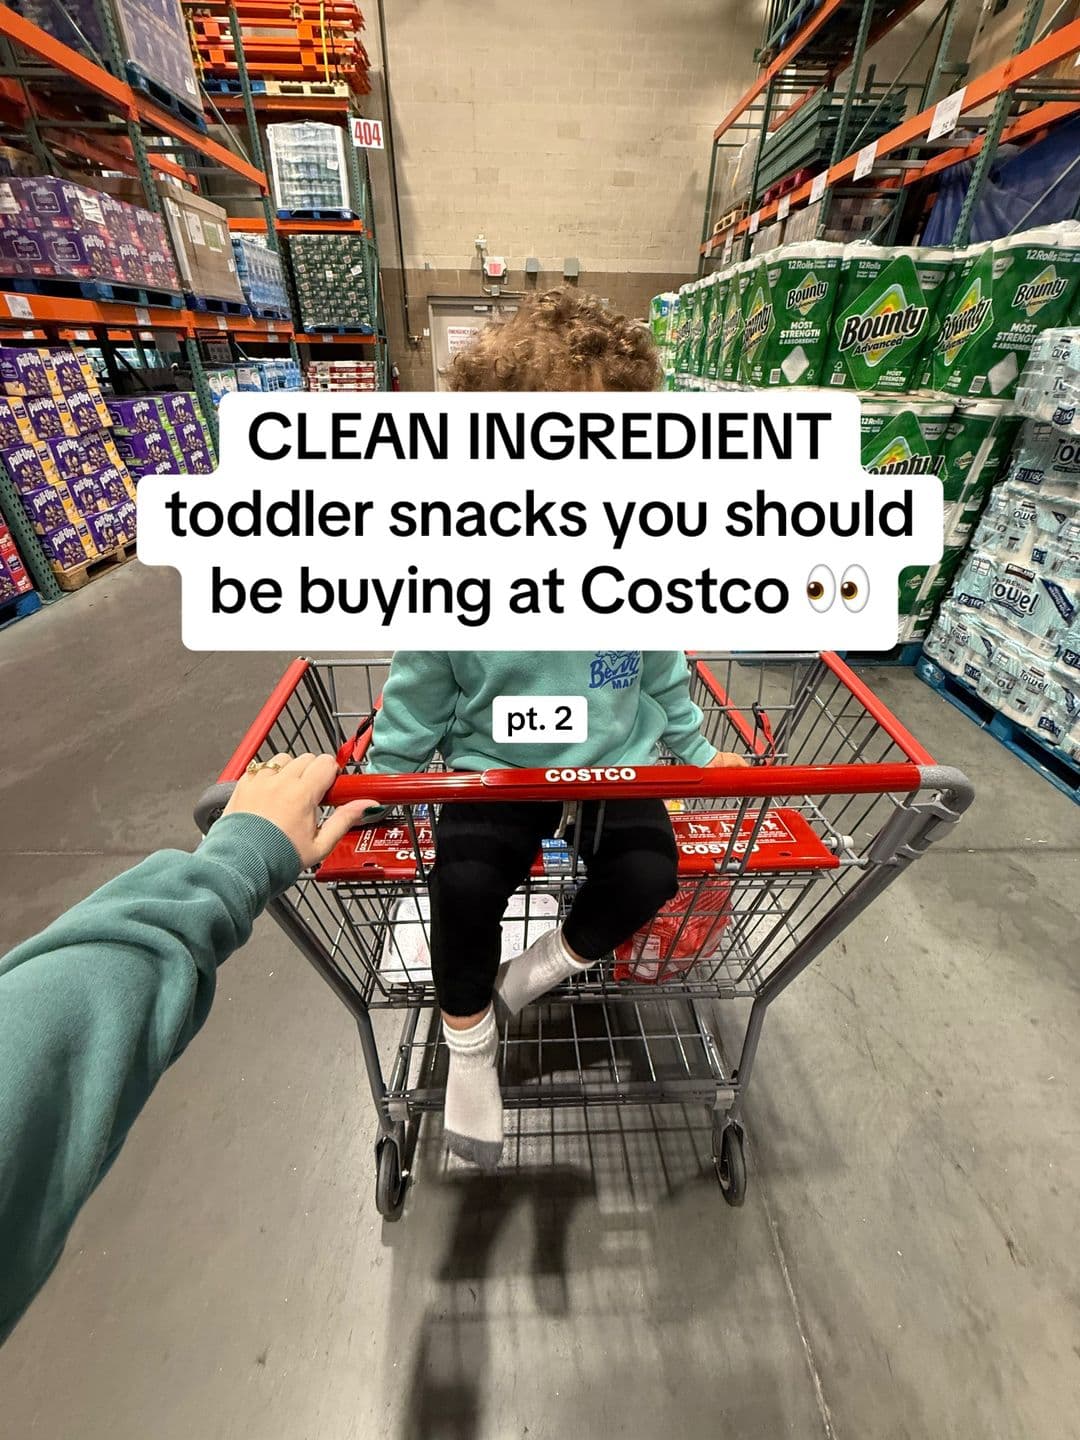

Clean-ingredient toddler snacks at Costco, delivered as five product-and-proof pairs.
Related store-list breakouts
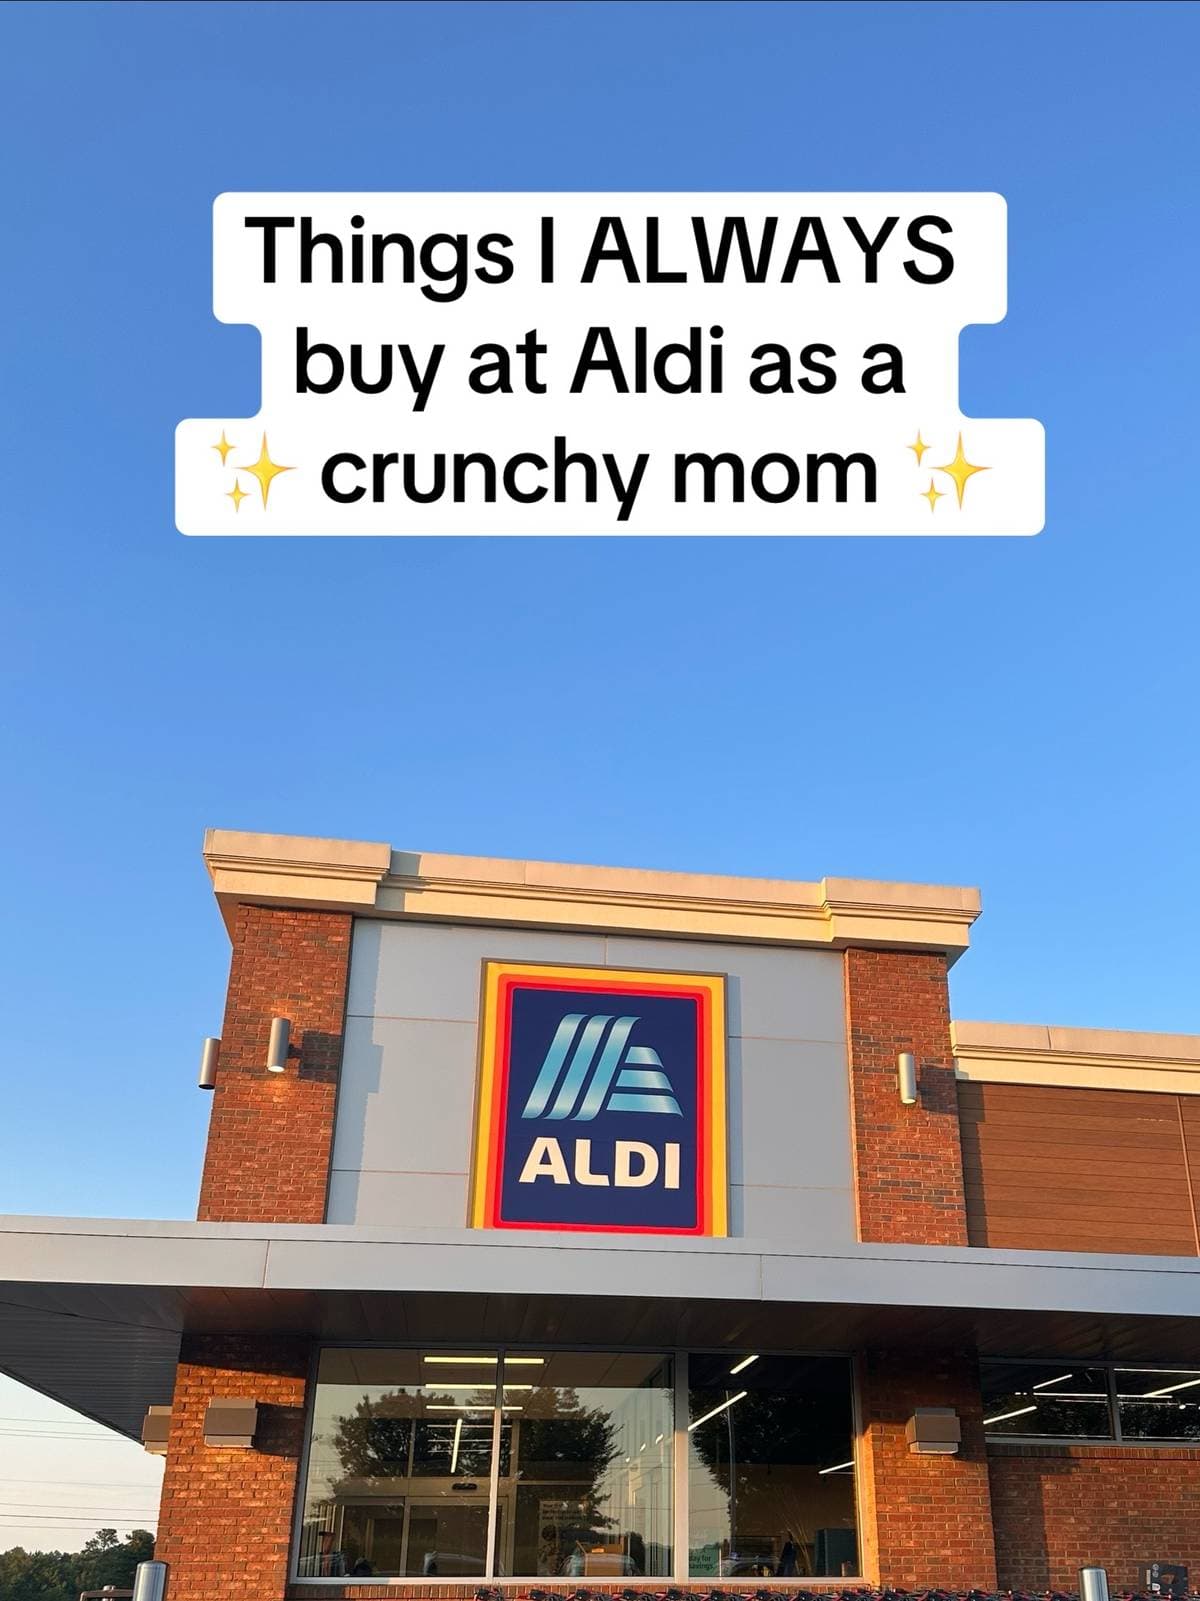
Clean-ingredient Aldi must-haves in the same 11-image shopping-list format.
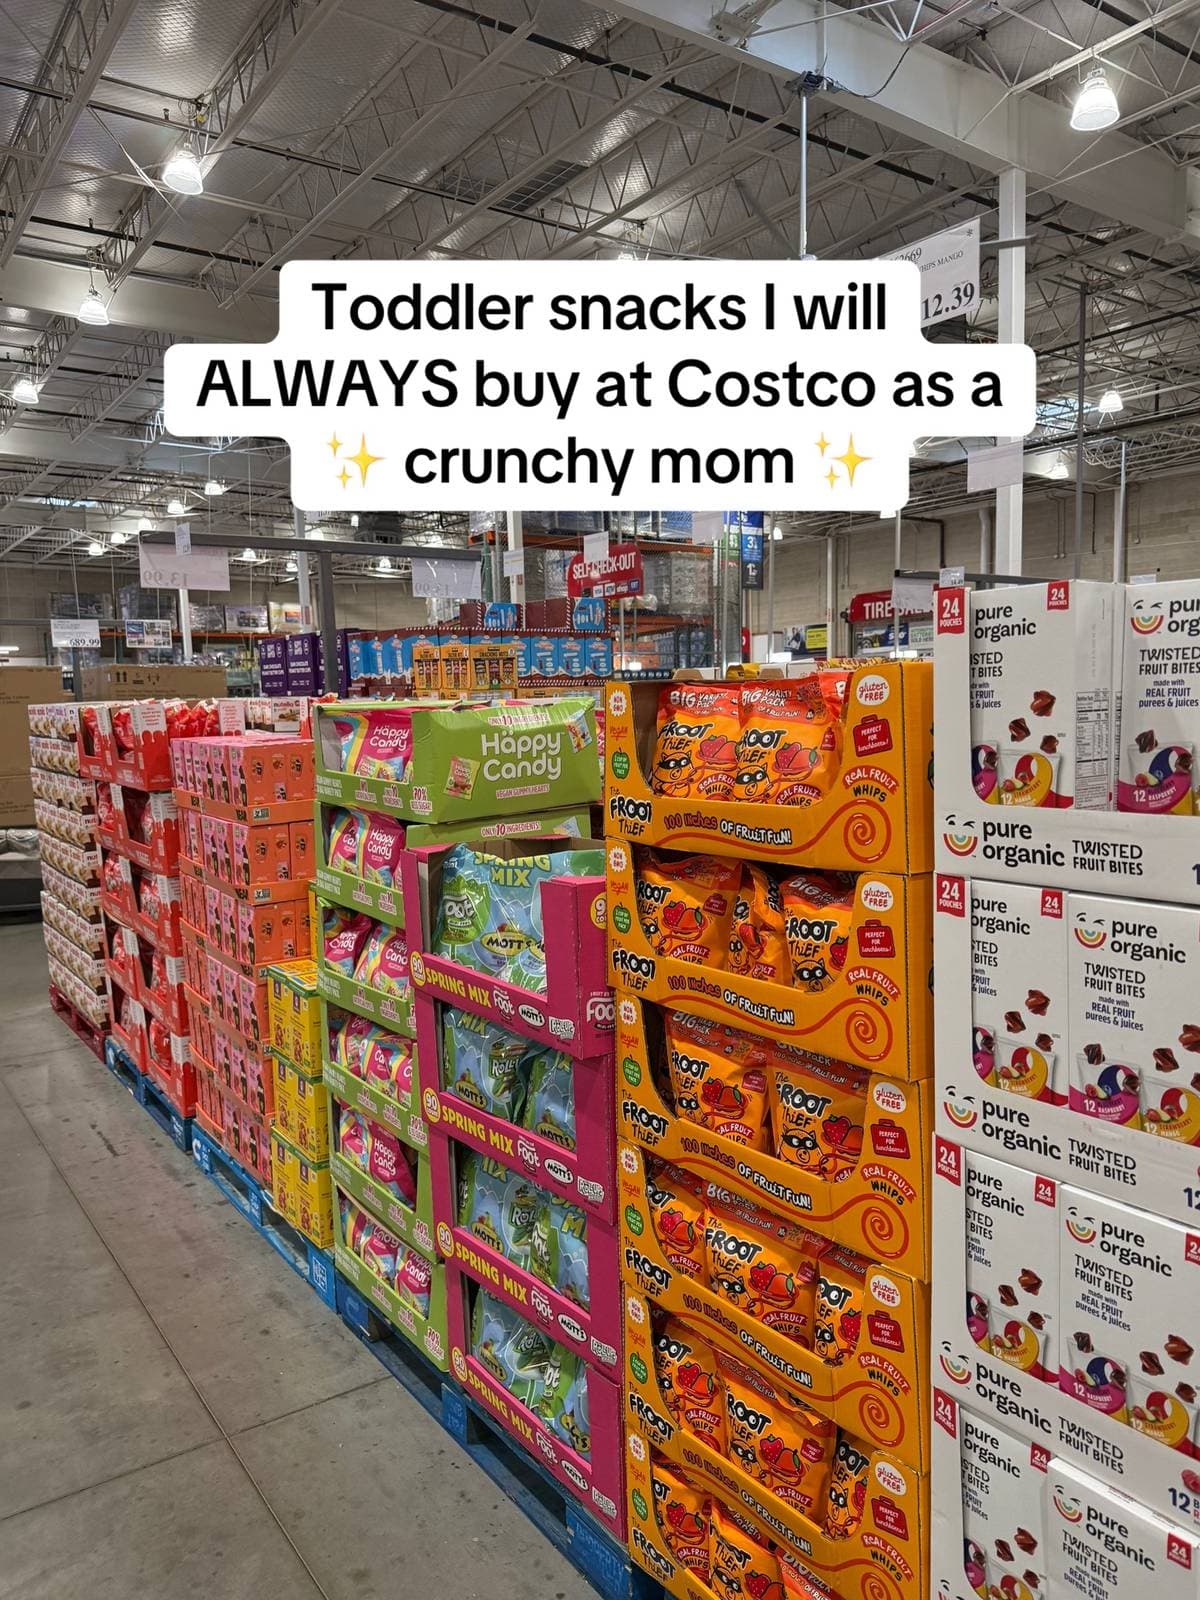
A later 11-image Costco toddler-snack list with a substantial but much smaller result.
Matched ordinary controls
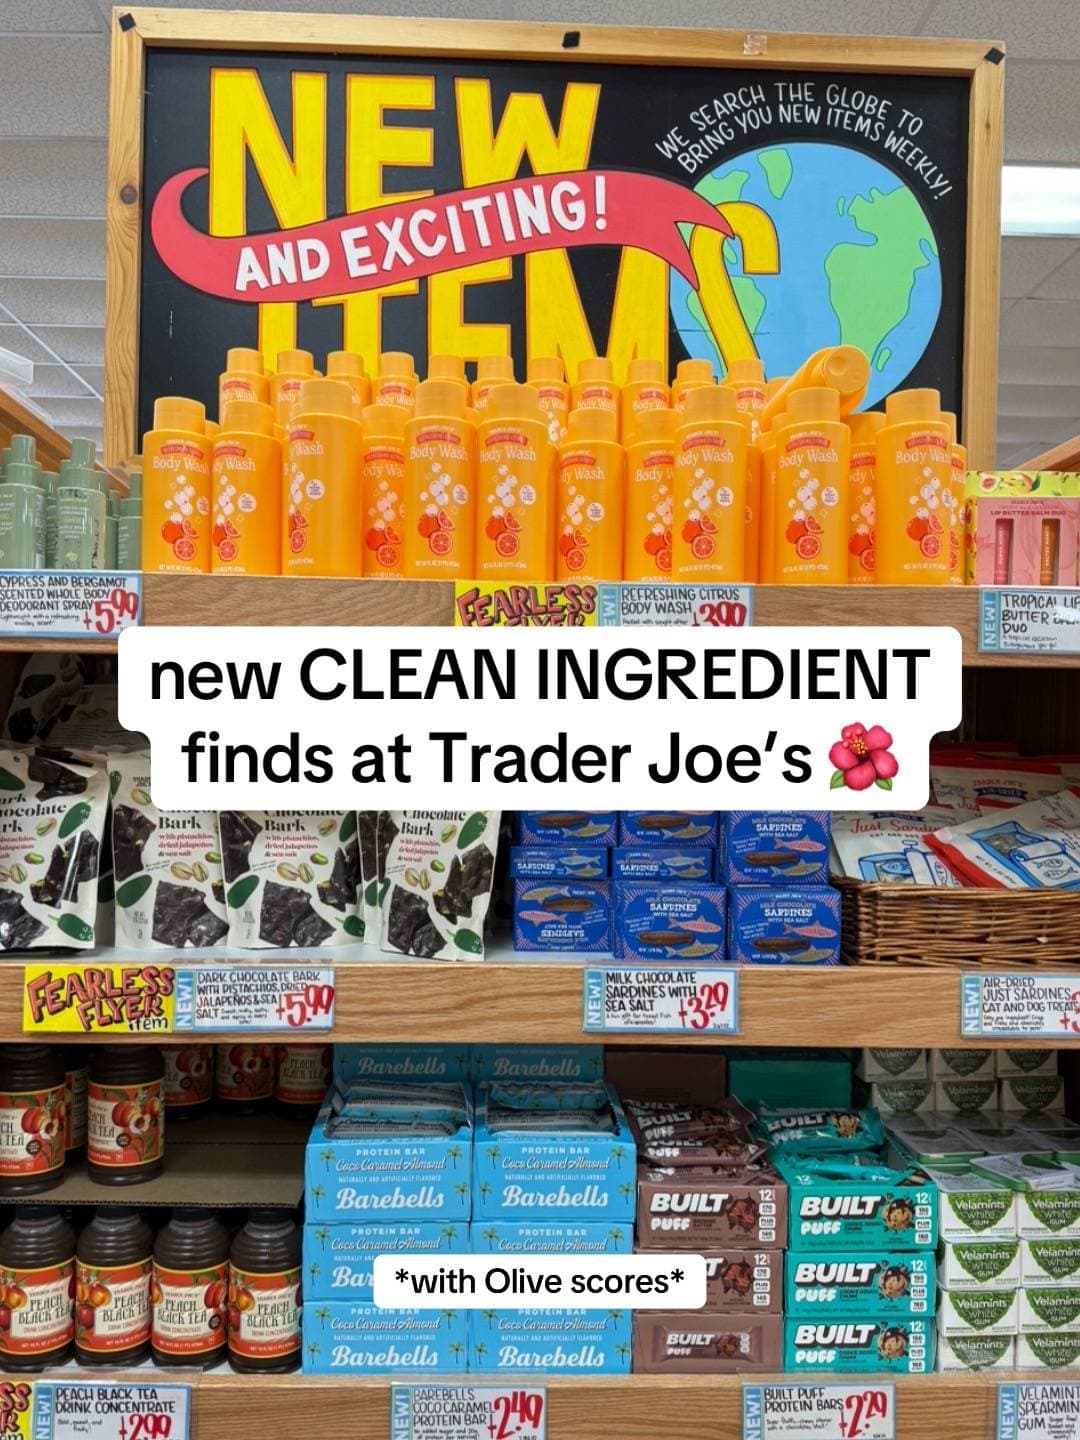
Crunchy-mom-approved clean-ingredient arrivals at Trader Joe’s.
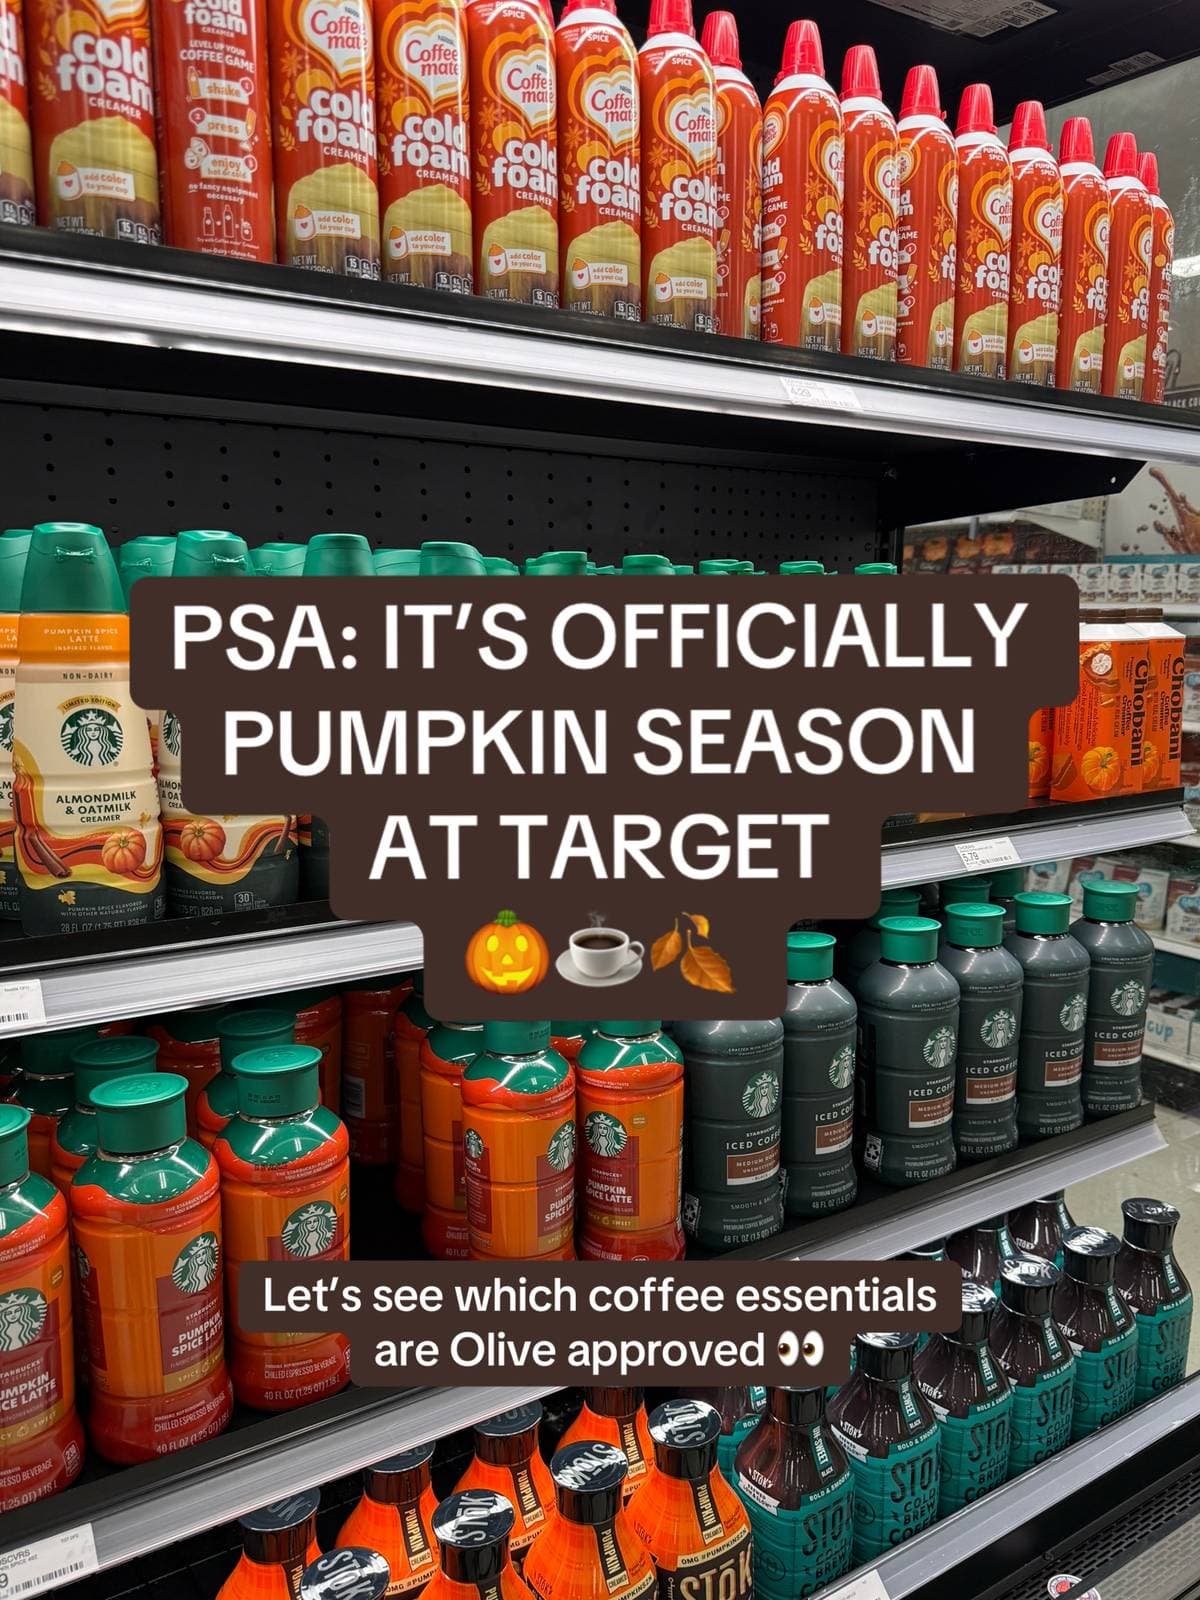
Seasonal coffee essentials paired with Olive scanner results.
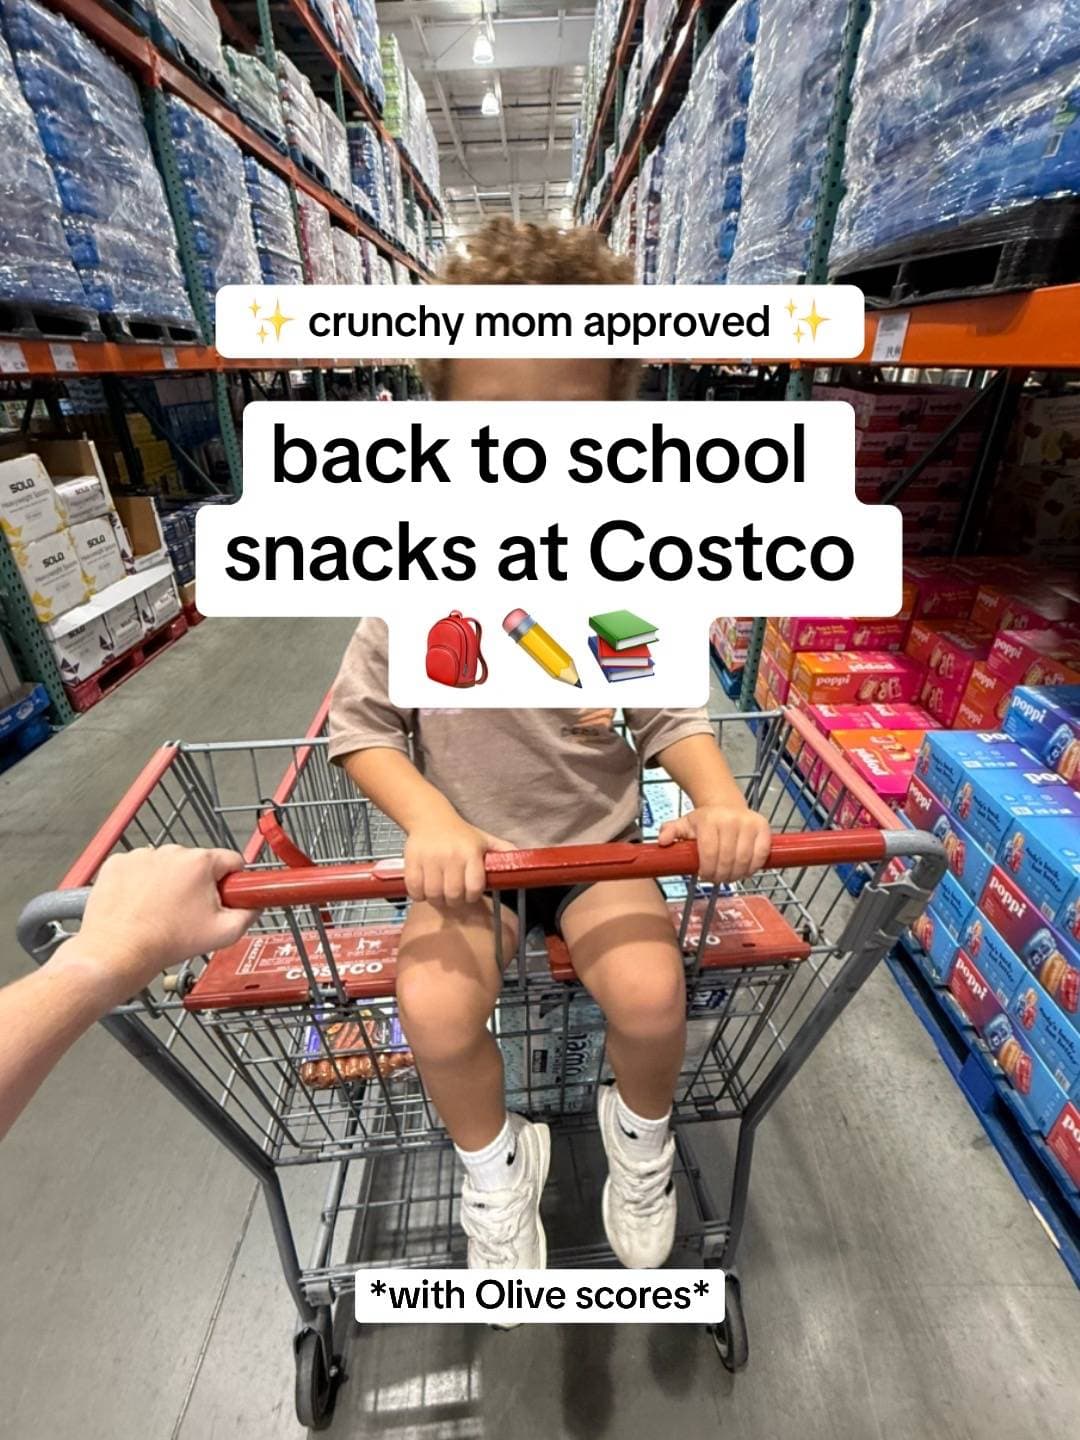
Back-to-school snacks at Costco that are described as crunchy-mom approved.
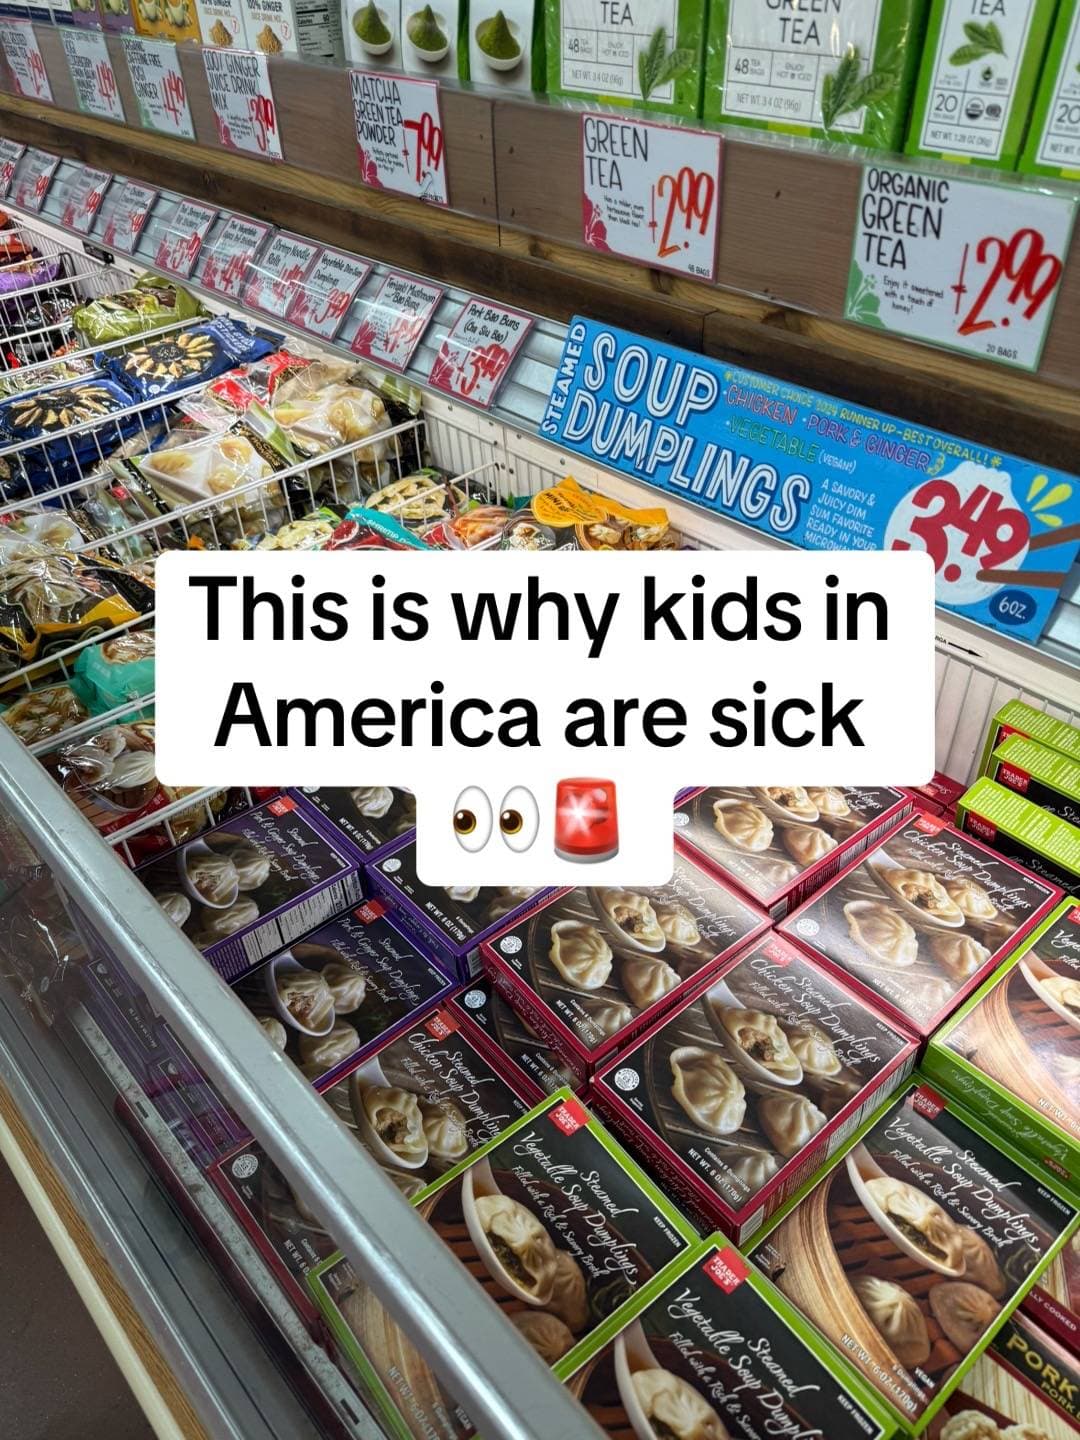
An 11-image ingredient-warning post about seed oils, sugar, and additives.
These are public counter snapshots, not retention or conversion data. The direct hydration and creator feed even differed by three plays and eight comments during the same run. Counts move, and endpoints do not always agree.
This is an independent case study of public third-party content, not a reels.chat campaign or customer result. reels.chat did not create or publish the content and has no private campaign analytics for it.
Start with the TikTok slideshow, not the X explanation
An X post from 19 August 2026 framed the slideshow as a stealth funnel: a utility app hidden inside a Costco haul.
That is a useful hypothesis generator. It is not a result. One X explainer does not establish how common the tactic is, whether the app caused the reach, or whether another creator can repeat it.
The actual photo post gives us a narrower beat sheet:
- Audience and setting: a child sits in a Costco cart, photographed from the shopper’s point of view.
- Bounded promise: the text offers “clean ingredient” toddler snacks and labels this as part two.
- Product: a package is shown in the aisle or cart.
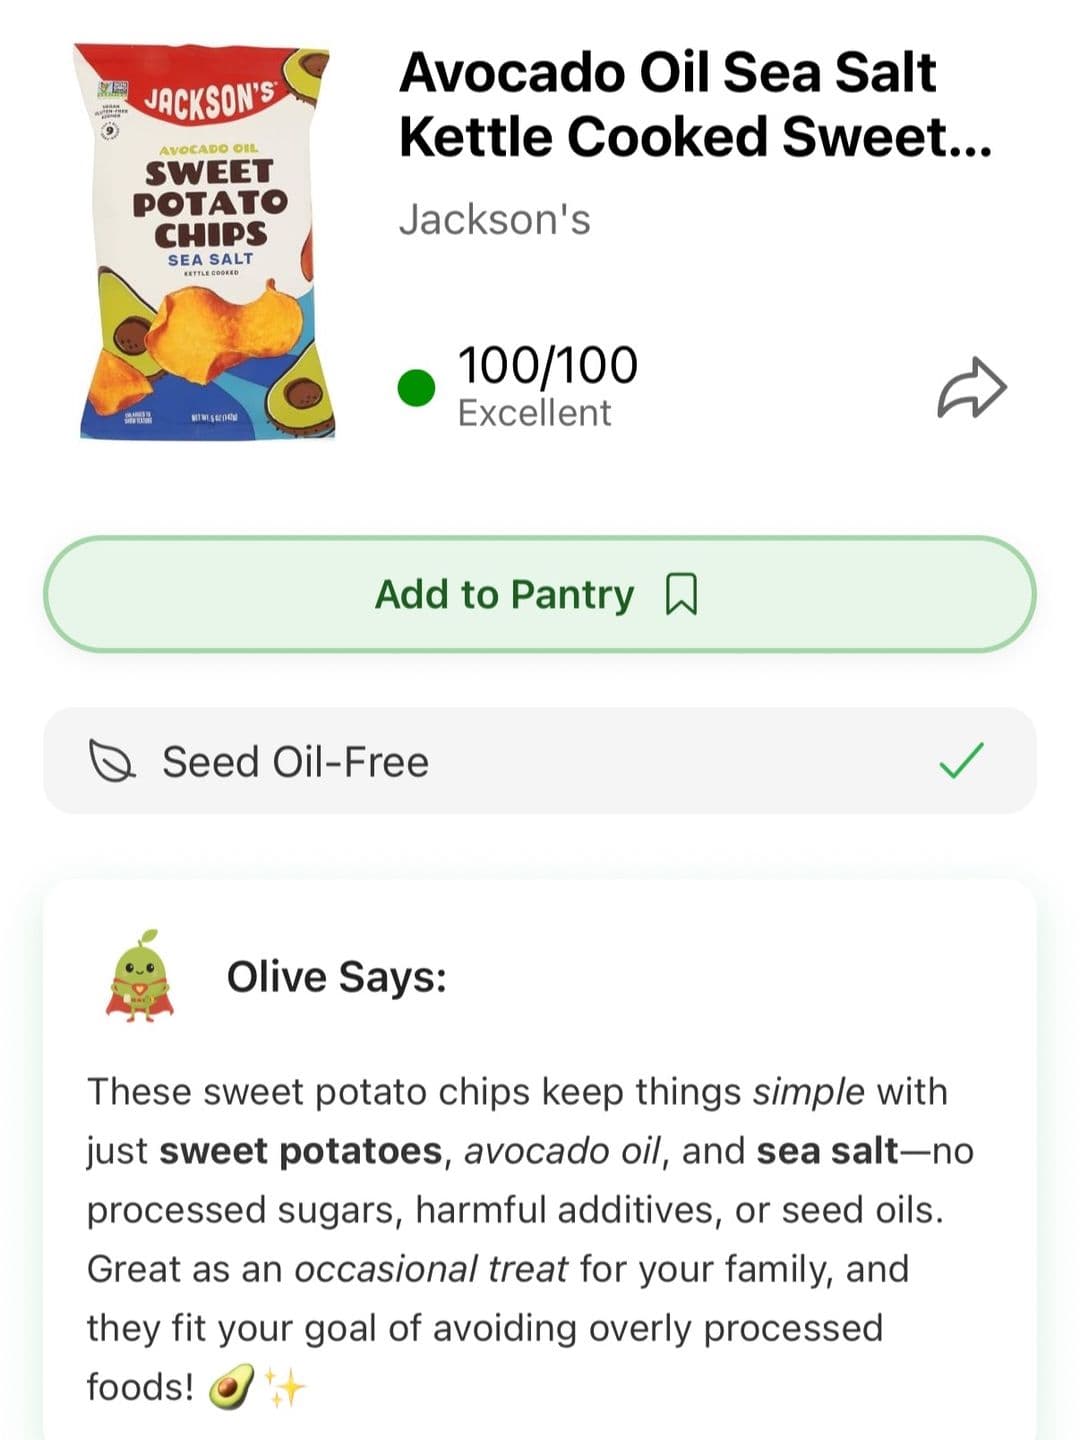
- Proof: an Olive app screen scores that exact product and explains the result.
- Repeat: product and proof alternate until the 11th slide.
That last detail changes the diagnosis. There is no late app reveal after ten neutral shopping pictures. The interface first appears on slide three, then returns on slides five, seven, nine, and 11. The product is woven through the list.
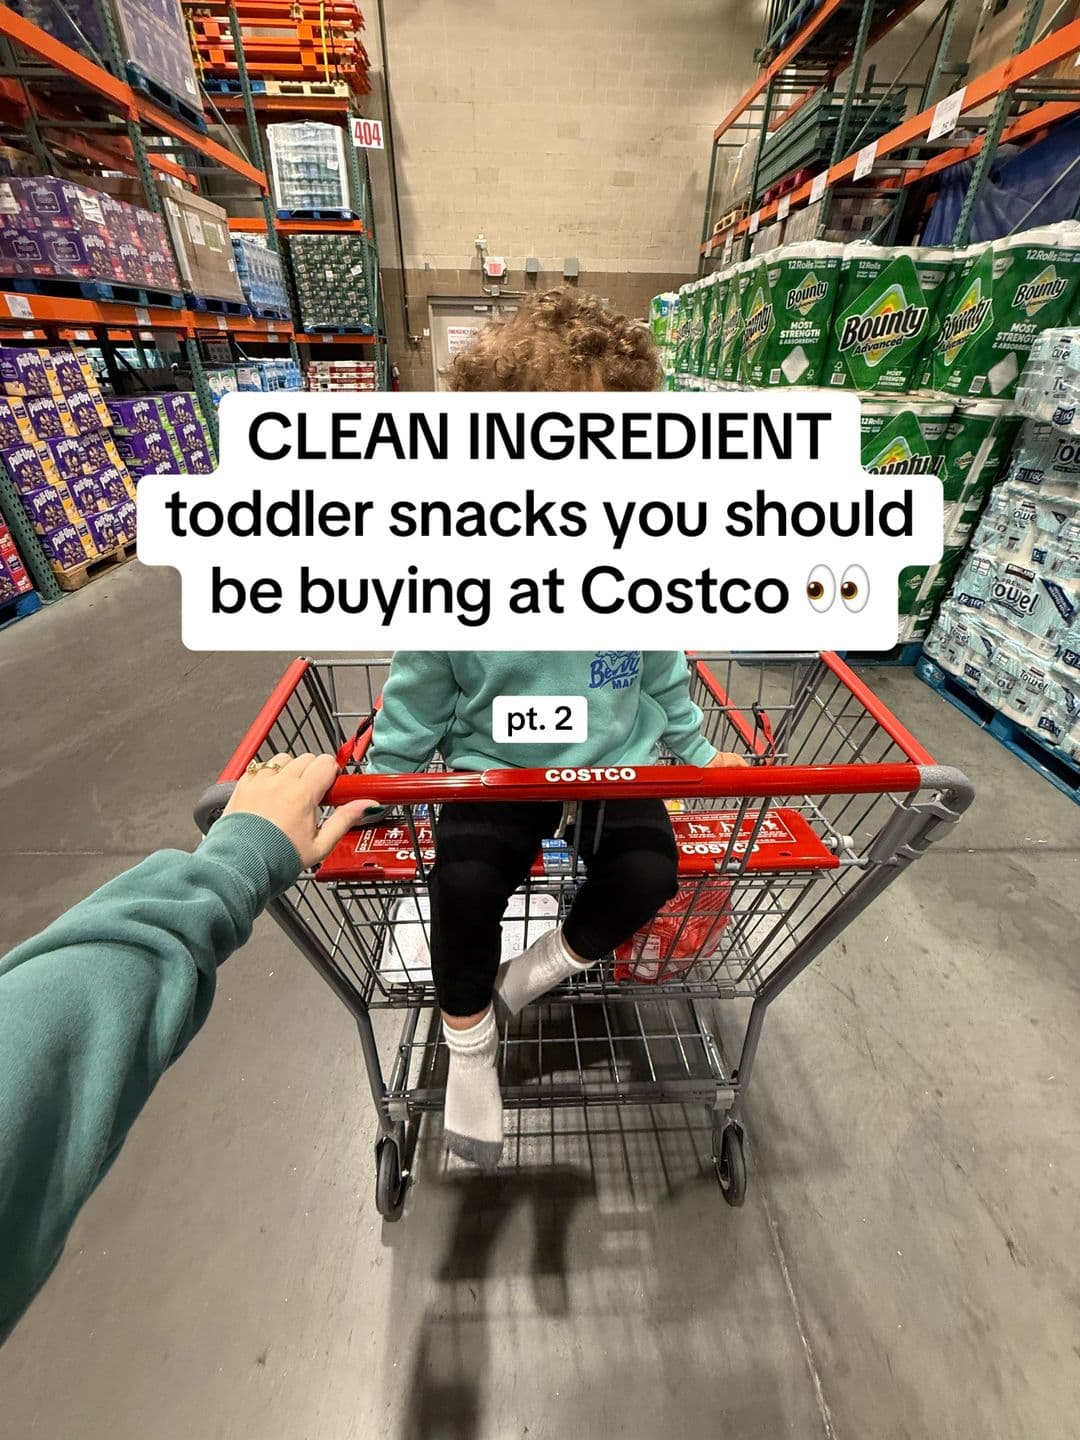
Slide 1 of 11, captured from TikTok on 24 August 2026. The cart, child, Costco aisle, audience, and promised list all arrive in one frame.
Three causes are mixed together
“The Costco hook worked” compresses three different jobs into one sentence. Each needs a different confirmation test.
| Possible cause | What the public evidence supports | What a reader could test |
|---|---|---|
| Cart opening | The cart makes the retailer, audience, and bounded snack-list promise visible before any product detail | Keep the list fixed; compare cart, shelf, receipt, and product-first openings |
| Save-sheet format | Eleven images pair recognisable products with judgements, while other list lengths on the account produced different outcomes | Keep the products and proof stable; vary only the useful sequence |
| Topic–proof loop | Each product screen supplies a reason the item belongs on the list, so the app appears while answering the opening | Keep the list; compare product-only slides with product-and-proof pairs |
Several causes may be true at once. Public counters cannot assign each one a percentage.
Cause 1: the cart makes the promise legible
The first slide works hard. The Costco warehouse is recognisable. A child in the cart identifies the parent use case without a paragraph of setup. “Clean ingredient toddler snacks” names the filter. “Pt. 2” suggests a finite series from someone who has already done this before.
That does not make a cart a reusable formula. The same account published a 13-image back-to-school snack list at Costco that had 2,995 plays in our snapshot. It used the retailer, the snack category, a parent-oriented filter, and a long photo-post format. It remained below the account’s 8,368-play median.
The creator also published an 11-image ingredient-warning post with 3,052 plays, and a 12-image clean-arrivals list from Trader Joe’s with 1,330. A shopping setting can clarify a promise. It cannot manufacture demand for the promise.
Then there is the Aldi comparison at the other extreme. The same creator’s 11-image clean-ingredient Aldi list reached 5,309,870 plays. That weakens “Costco was the trick.” A store may make the list concrete, but the evidence does not crown one retailer.
The opening is still worth testing. Just test it as an opening, not as Costco cosplay with 10 unrelated slides attached.
Cause 2: 11 images made a useful container
The post does not deliver nine tips, a recap, and a call to action. It uses one opening plus five two-slide units.
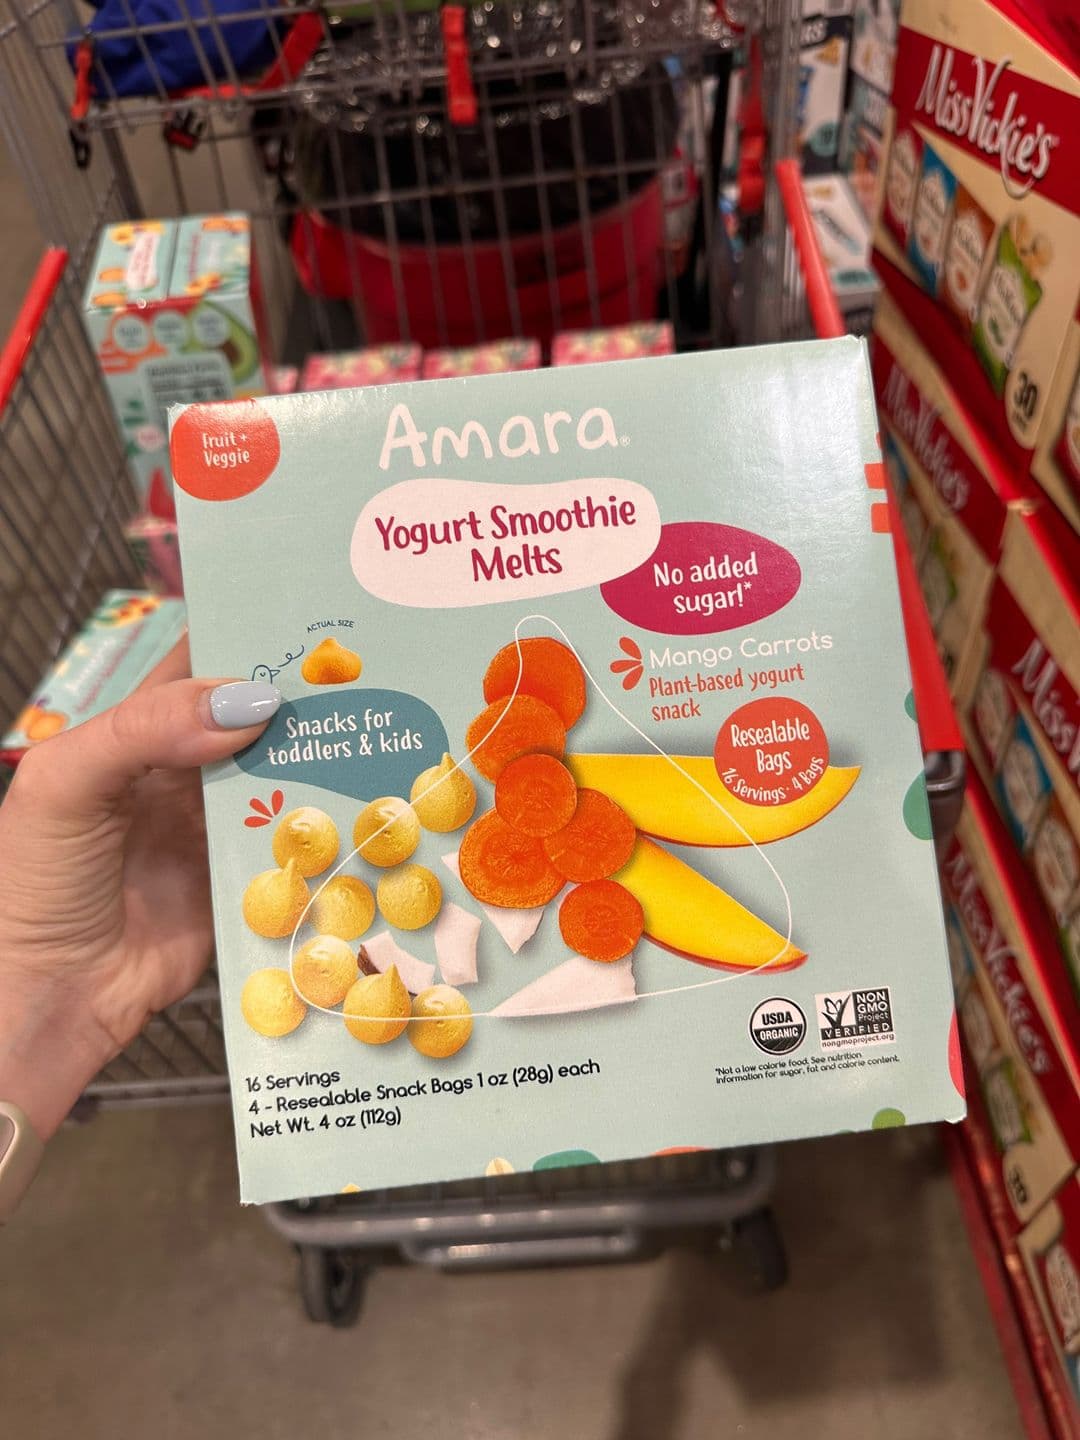
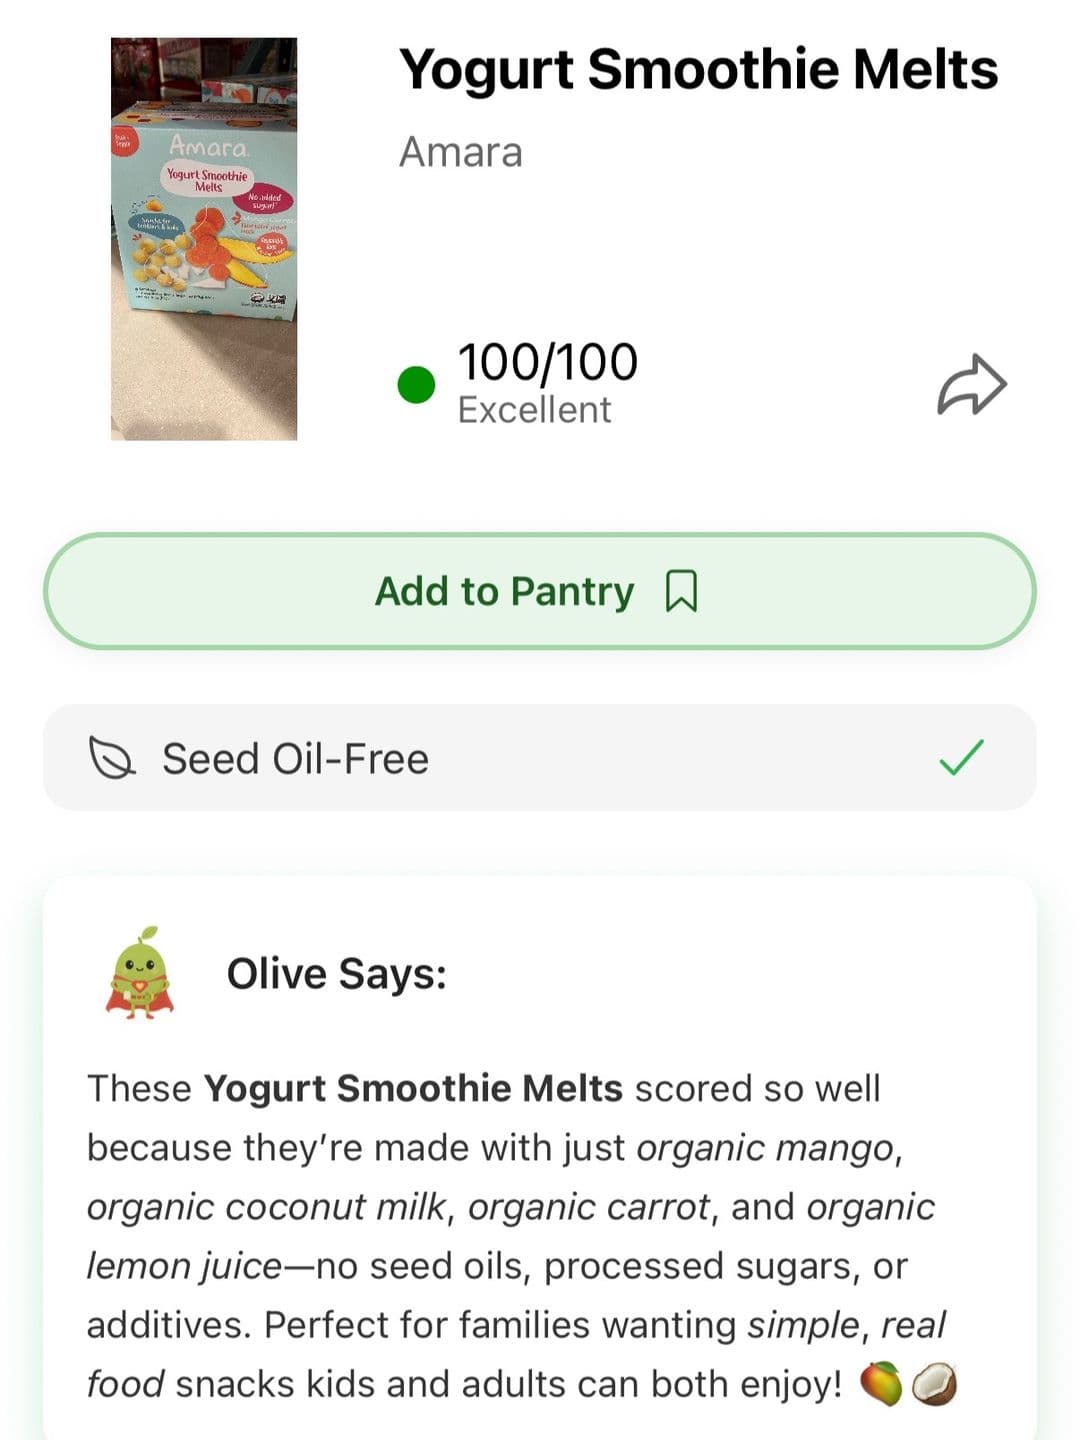
Slides 2–3, captured on 24 August 2026. A product photograph is immediately followed by its 100/100 Olive result and ingredient explanation.
The repeated pair gives a viewer two kinds of evidence. The shelf photo establishes that the item is real and available in the promised shop. The interface screen explains why it passed the creator’s “clean ingredient” filter.
Eleven images suit that structure, but 11 is not the cause. The Aldi breakout also used 11. So did the 3,052-play ingredient-warning control. A later Costco toddler-snack list used 11 and reached 451,457 plays: strong, but roughly 21 times smaller than the cited post.
Same account. Same image count. Results from 3,052 to 9.57 million.
“Use 11 slides” survives contact with the data for about three seconds.
The transferable part is the unit of progress. Every swipe either introduces a candidate product or resolves whether it passed. The sequence keeps moving without changing the viewer’s job.
Cause 3: the app proves the list
The first frame does not promise “things I saw at Costco.” It promises clean-ingredient toddler snacks the viewer should buy. Product photography alone cannot prove that filter.
The Olive screens do. Each names the product, gives it a score, marks it seed-oil-free, and supplies an ingredient explanation. Even the 74/100 fruit-bar screen preserves the structure while adding a qualification: the app calls it an occasional treat.
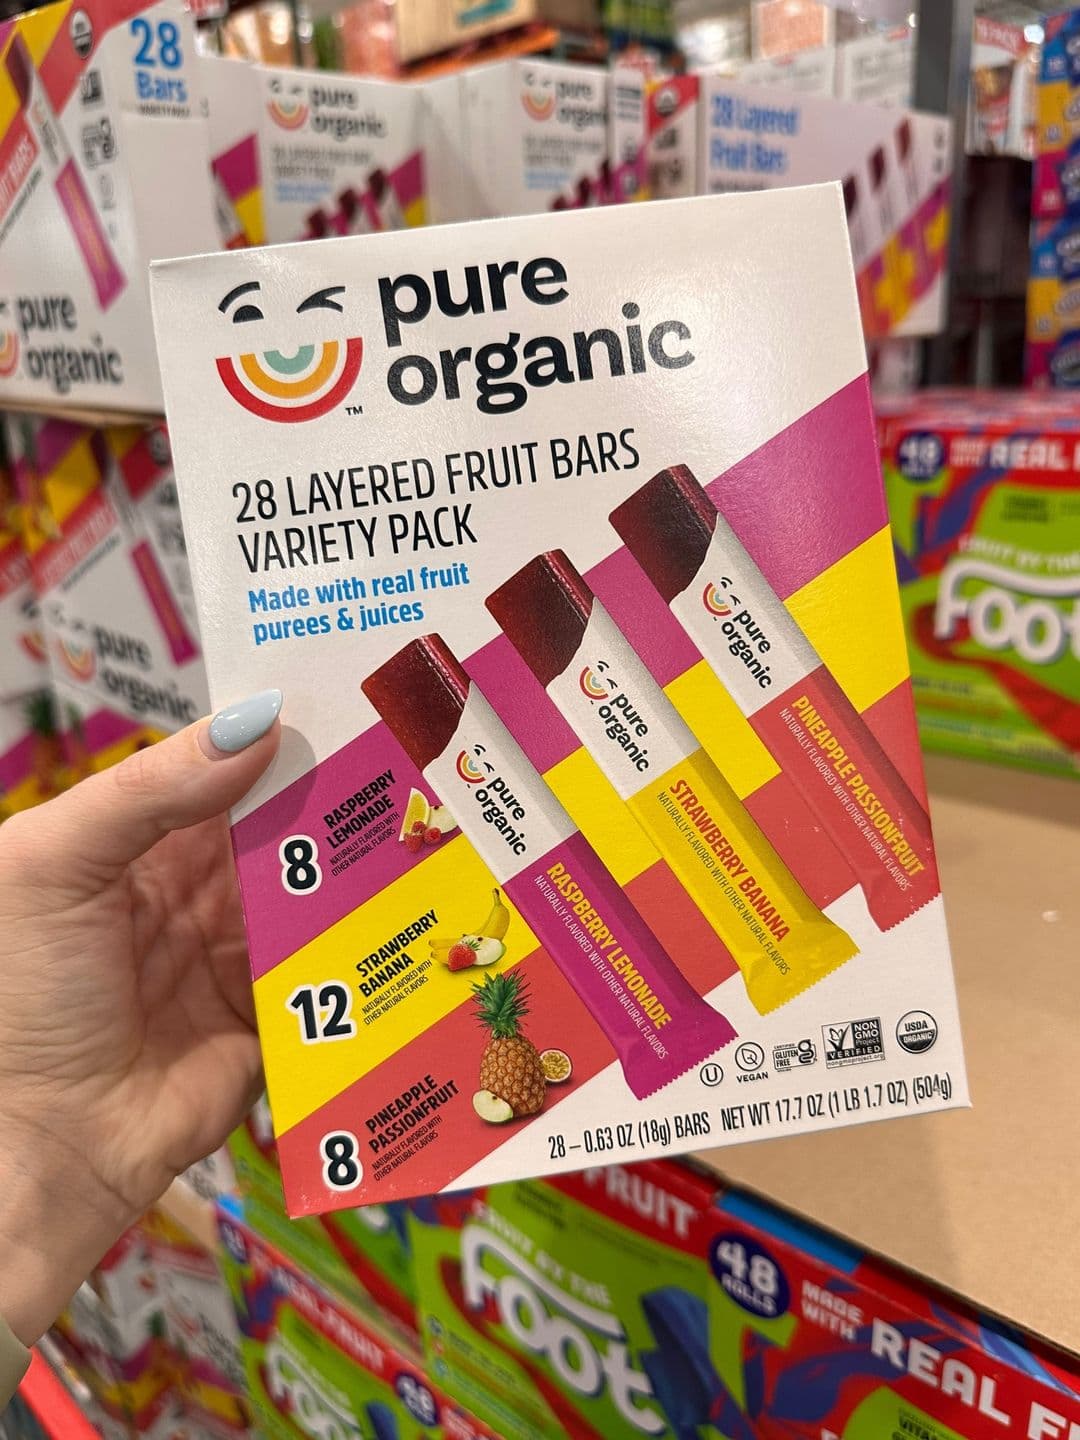
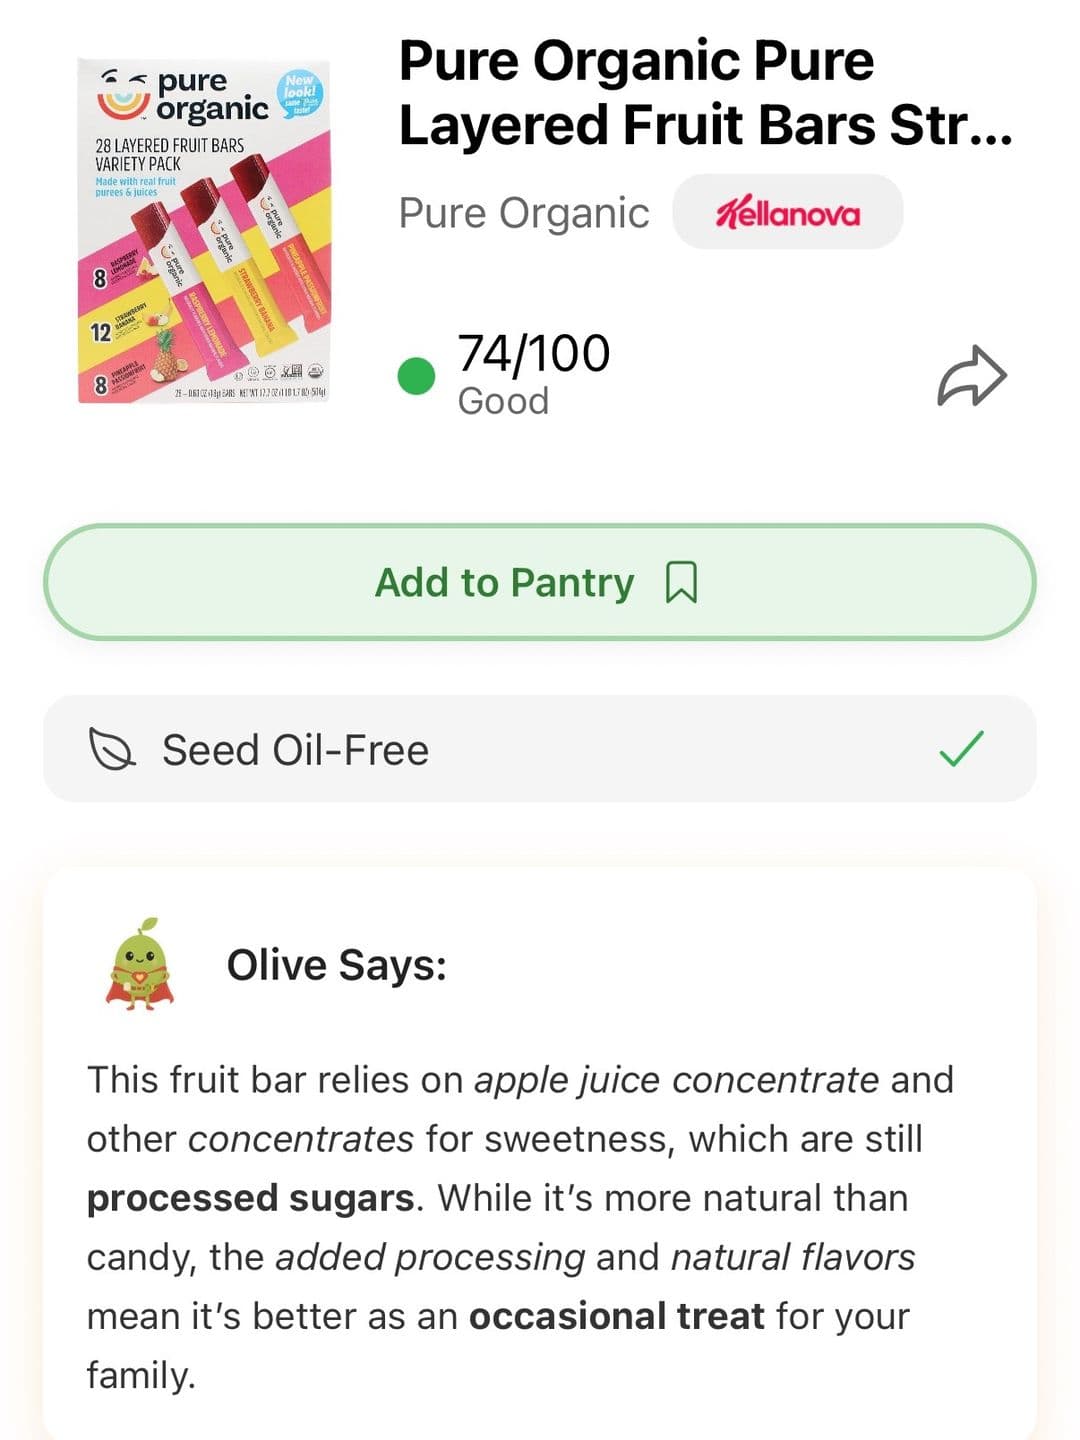
Slides 8, 9, and 11, captured on 24 August 2026. The proof layer is not a final advert: it recurs after each product and includes a qualified 74/100 result.
This creates a topic–proof loop:
- The opening asks which toddler snacks meet a clean-ingredient standard.
- A package gives the viewer one candidate answer.
- The app explains whether and why it qualifies.
- The next package renews the question.
The product earns attention by doing the checking. That is more useful than hiding an app logo until the final frame and hoping the viewer feels grateful for the surprise.
It also explains why the save count is interesting. The snapshot recorded 86,943 saves, about 0.91% of plays. A viewer could reopen the post in a store and retrieve both the package and its assessment. Saves do not reveal motive, so we cannot claim 86,943 shopping trips. They are a clue that the reference shape matched a keepable job.
What the controls falsify
The latest creator feed returned 33 photo posts with a median of 8,368 plays. The cited post was 1,143 times that baseline.
Four visually captured ordinary controls sat between 1,330 and 3,052 plays. They included clean ingredients, a shopping setting, scanner proof, Costco, and slideshow lengths from 11 to 13 images. Those features appeared without a breakout.
The controls do not isolate one winning detail. They kill several lazy conclusions:
- Costco alone was not sufficient.
- A long carousel was not sufficient.
- Clean-ingredient language was not sufficient.
- Showing scanner results was not sufficient.
- Using exactly 11 images was not sufficient.
The Aldi and later Costco posts also stop us making the opposite mistake. Store-based clean-product lists can work repeatedly for this creator, just at very different scales. This is stronger than one accidental winner, but it remains one account. It is not platform prevalence.
What this case study suggests testing
If you want to test the mechanism on your own content, start with one list and one proof system. Keep the products, order, scores, caption, and closing behaviour stable.
Then make three first slides:
- A child in the cart inside the store.
- The same products grouped on a shelf or kitchen bench.
- A receipt beside the same products.
Compare each result with the account’s recent photo-post median. Check saves because the execution is designed as a reference, then use swipe-through or completion data if you own the account. A strong first-slide result with a weak second-slide continuation would point to a handoff problem, not proof that carts are magic.
In a second test, keep the best opening and vary the proof. Compare a product-only list with a product-and-score sequence. Do not change the retailer, topic, slide count, and call to action in the same round. Another winner would be pleasant. A diagnosis would still be impossible.
What to copy
Copy the division of labour:
- Slide one identifies the audience, setting, filter, and finite payoff.
- Product slides make each recommendation easy to recognise later.
- Proof slides answer why the item belongs on the list.
- The product appears while it is useful, not as a detached reveal.
- Results are judged beside ordinary work from the same creator.
Do not copy the cart and call the research finished. The cart turned a broad concern into an immediate shopping scene. The five product–proof pairs turned that concern into something a parent could keep.
That is the hypothesis worth testing. The parent method, why this video worked, shows how to separate the causes before changing the smallest thing that can confirm one. A later cheat-sheet post uses a similar save-sheet diagnosis in why the luxury certs cheat-sheet slideshow worked.
Keep reading
Diagnosis
TikTok hold rate: when the hook works but viewers leave
Diagnose a weak TikTok hold rate after the hook by checking the promise, pacing, audience fit, and the exact retention metric you are reading.
Diagnosis
Why this CareSkin before-and-after TikTok slideshow worked
A 12.5M CareSkin before-and-after TikTok slideshow mixed an acne glow-up, an app reveal, and product proof. See what the evidence supports.
Diagnosis
Why this couple-photo TikTok carousel worked
A 10.4M couple-photo TikTok carousel turned pose inspiration into a five-swipe proof loop. See what made the format useful and repeatable.